Gdoc/Admin

Artificial Intelligence

Artificial intelligence (AI) systems already greatly impact our lives — they increasingly shape what we see, believe, and do. Based on the steady advances in AI technology and the significant recent increases in investment, we should expect AI technology to become even more powerful and impactful in the following years and decades.

It is easy to underestimate how much the world can change within a lifetime, so it is worth taking seriously what those who work on AI expect for the future. Many AI experts believe there is a real chance that human-level artificial intelligence will be developed within the following decades, and some think it will exist much sooner.

How such powerful AI systems are built and used will be very important for the future of our world and our own lives. All technologies have positive and negative consequences, but with AI, the range of these consequences is extraordinarily large: the technology has immense potential for good. Still, it comes with significant downsides and high risks.

A technology that has such an enormous impact needs to be of central interest to people across our entire society. But currently, the question of how this technology will get developed and used is left to a small group of entrepreneurs and engineers.

With our publications on artificial intelligence, we want to help change this status quo and support a broader societal engagement.

On this page, you will find key insights, articles, and charts of AI-related metrics that let you monitor what is happening and where we might be heading. We hope that this work will be helpful for the growing and necessary public conversation on AI.

Key Insights on Artificial Intelligence

AI systems perform better than humans in language and image recognition in some tests

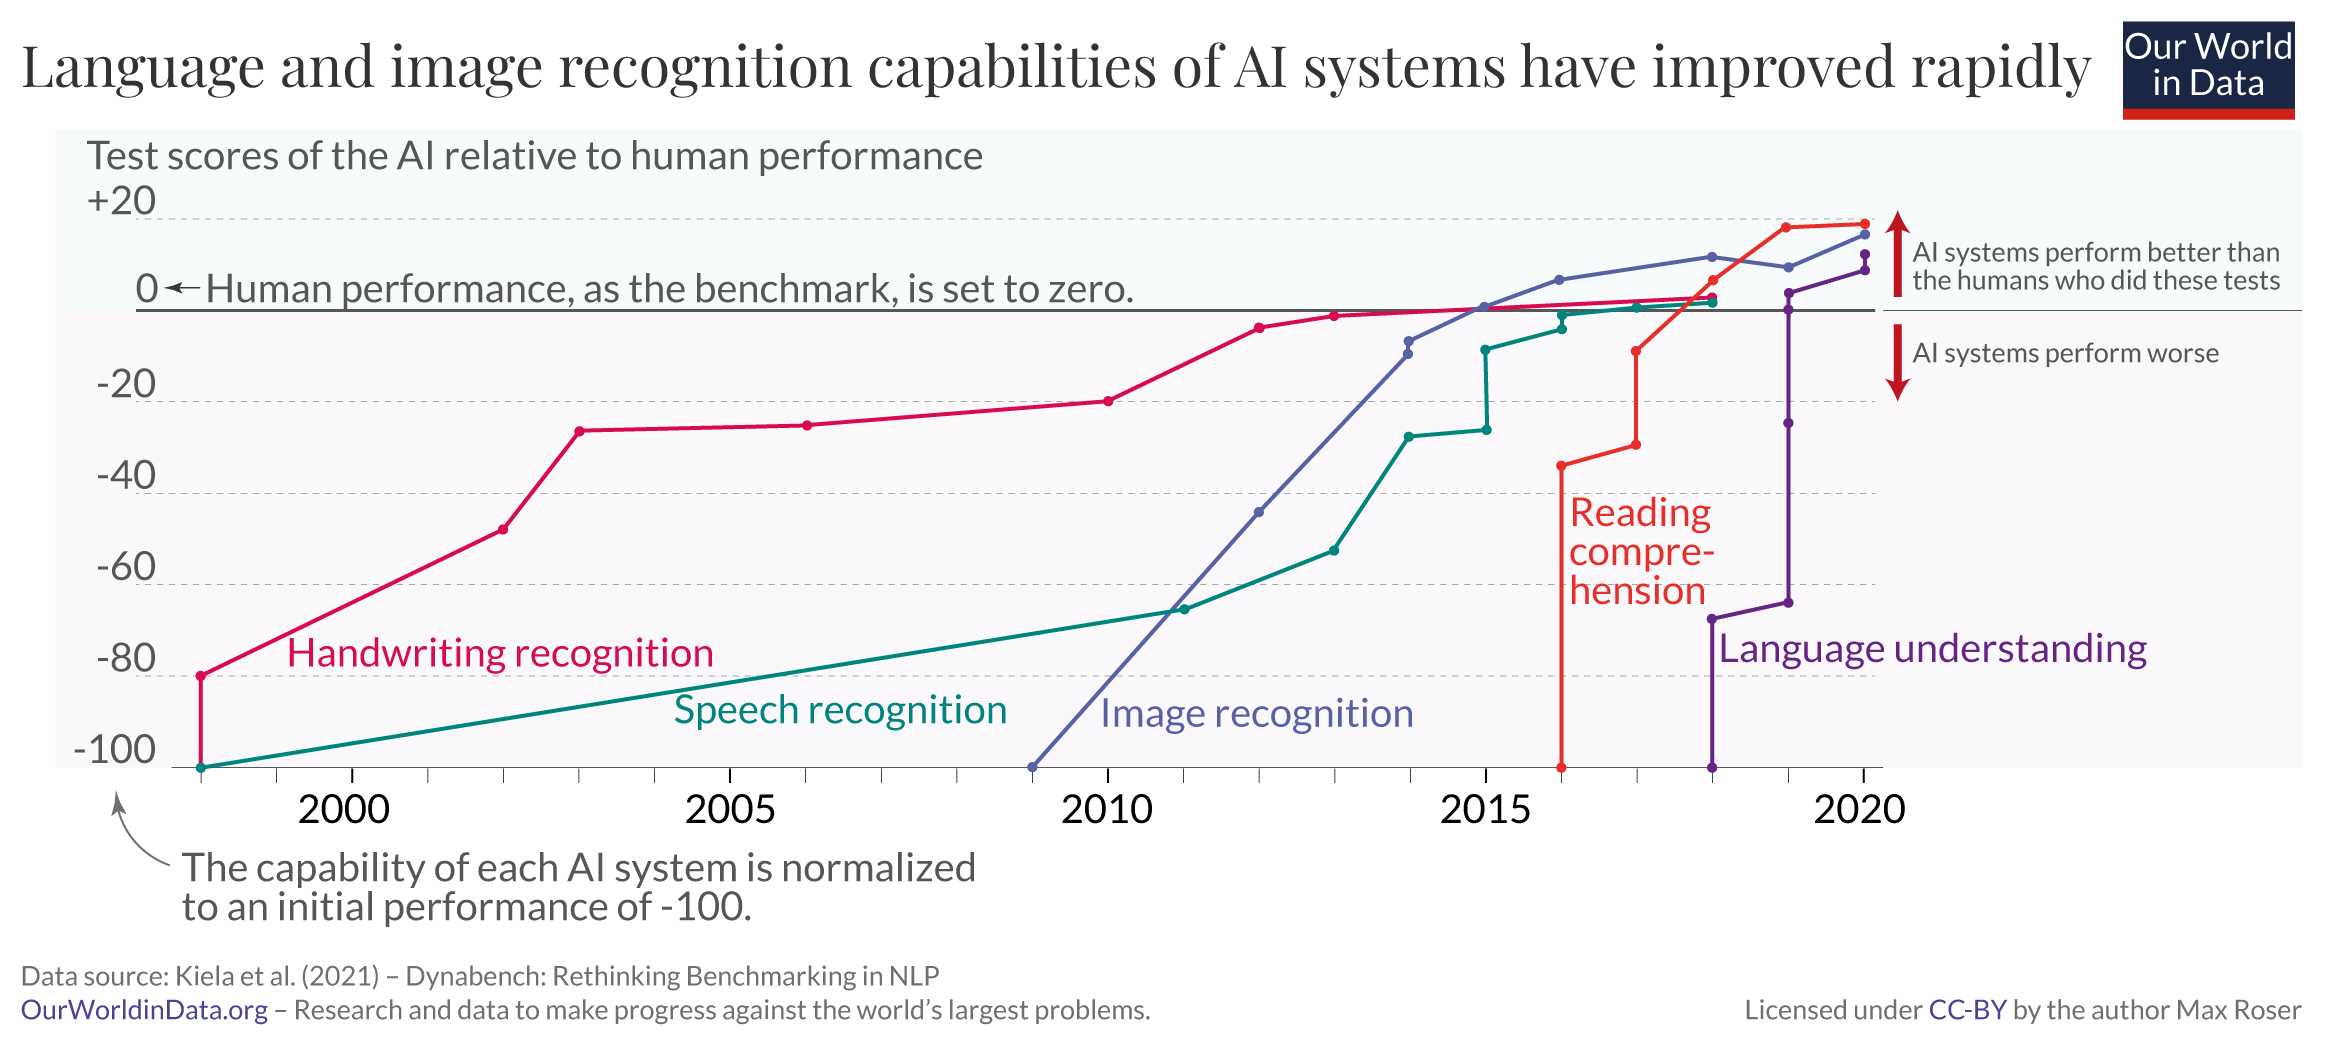
The language and image recognition capabilities of artificial intelligence (AI) systems have developed rapidly.

This chart zooms into the last two decades of AI development. The plotted data stems from several tests in which human and AI performance were evaluated in five domains: handwriting recognition, speech recognition, image recognition, reading comprehension, and language understanding.

Within each domain, the initial performance of the AI is set to –100. Human performance is used as a baseline, set to zero. When the AI’s performance crosses the zero line, it scored more points than humans.

Just 10 years ago, no machine could reliably provide language or image recognition at a human level. However, AI systems have become much more capable and are now beating humans in these domains, at least in some tests.

What you should know about this data
  • This chart relies on data published by Kiela et al. in Dynabench: Rethinking Benchmarking in NLP (2021). Detailed information on the benchmarks used to evaluate AI systems can be found in the paper.
  • The chart shows that the speed at which these AI technologies developed increased over time. Systems for which development was started early – handwriting and speech recognition – took more than a decade to approach human-level performance, while more recent AI developments led to systems that overtook humans in only a few years. However, one should not overstate this point. To some extent, this is dependent on when the researchers started to compare machine and human performance. One could have started evaluating the system for language understanding much earlier, and its development would appear much slower in this presentation of the data.
  • It is important to remember that while these are remarkable achievements — and show very rapid gains — these are the results from specific benchmarking tests. Outside of tests, AI models can fail in surprising ways and do not reliably achieve performance comparable to human capabilities.
legacy-wordpress-upload

AI systems can generate increasingly better images and text

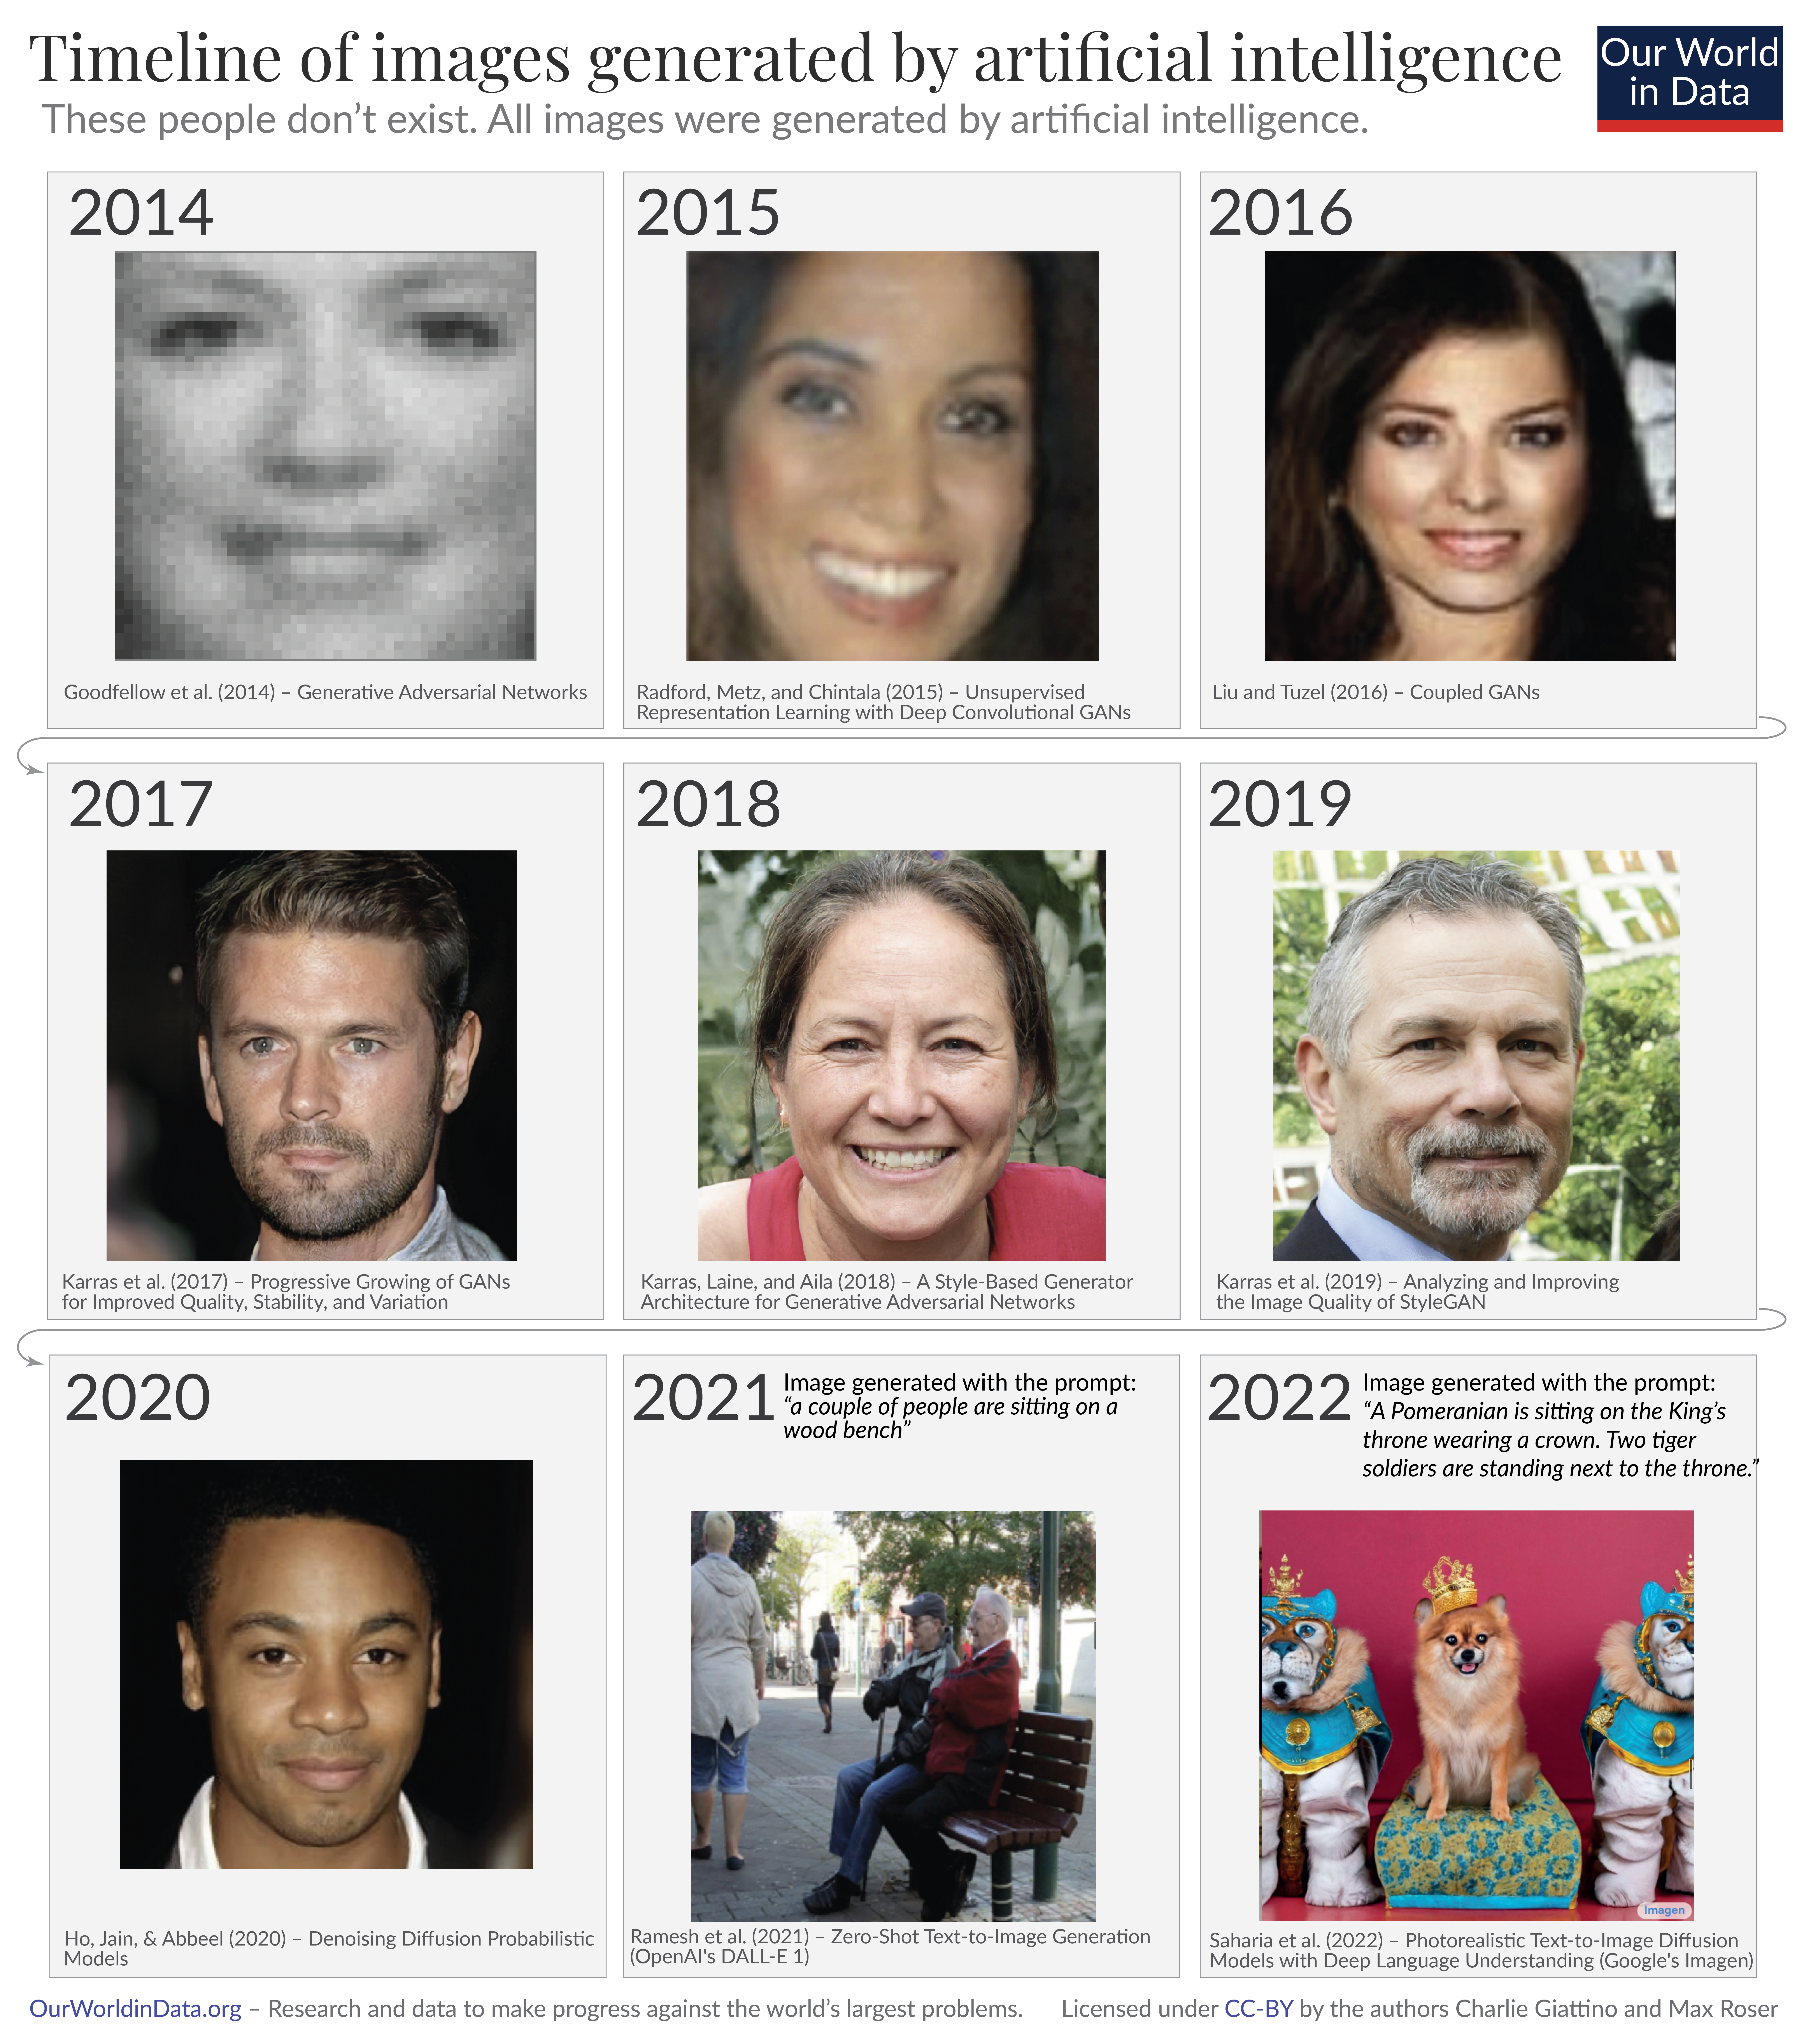
This series of nine images shows how these have developed over just the last nine years. None of the people in these images exist; all were generated by an AI system.

This is one of the critical evolutions of AI systems in recent years: not only do they perform well on recognition tasks, but they can also generate new images and text with remarkable proficiency.

Even more importantly, since 2021, the highest-performing AI systems – such as DALL·E or MidJourney – can generate high-quality, faithful images based on complex textual descriptions.

The ninth image in the bottom right shows that even the most challenging prompts – such as “A Pomeranian is sitting on the King’s throne wearing a crown. Two tiger soldiers are standing next to the throne” – are turned into photorealistic images within seconds.

A key takeaway from this overview is the speed at which this change happened. The first image is just eight years older than the last.

In the coming years, AI systems’ ability to easily generate vast amounts of high-quality text and images could be great – if it helps us write emails faster or create beautiful illustrations – or harmful – if it enables phishing and misinformation, and sparks incidents and controversies.

Timeline of images generated by artificial intelligence

The last decades saw a continuous exponential increase in the computation used to train AI

Current AI systems result from decades of steady advances in this technology.

Each small circle on this chart represents one AI system. The circle’s position on the horizontal axis indicates when the AI system was made public, and its position on the vertical axis shows the amount of computation used to train it. It’s shown on a logarithmic scale.

Training computation is measured in total floating point operations, or “FLOP” for short. One FLOP is equivalent to one addition, subtraction, multiplication, or division of two decimal numbers.

All AI systems shown on this chart rely on machine learning to be trained, and in these systems, training computation is one of the three fundamental factors that drive the system's capabilities. Other critical factors are the algorithms, the input data, and the parameters used during training.

The chart shows that over the last decade, the amount of computation used to train the largest AI systems has increased exponentially. More recently, the pace of this change has increased. We discuss this data in more detail in our article on the history of artificial intelligence.

As training computation increased, large language models have become much more powerful

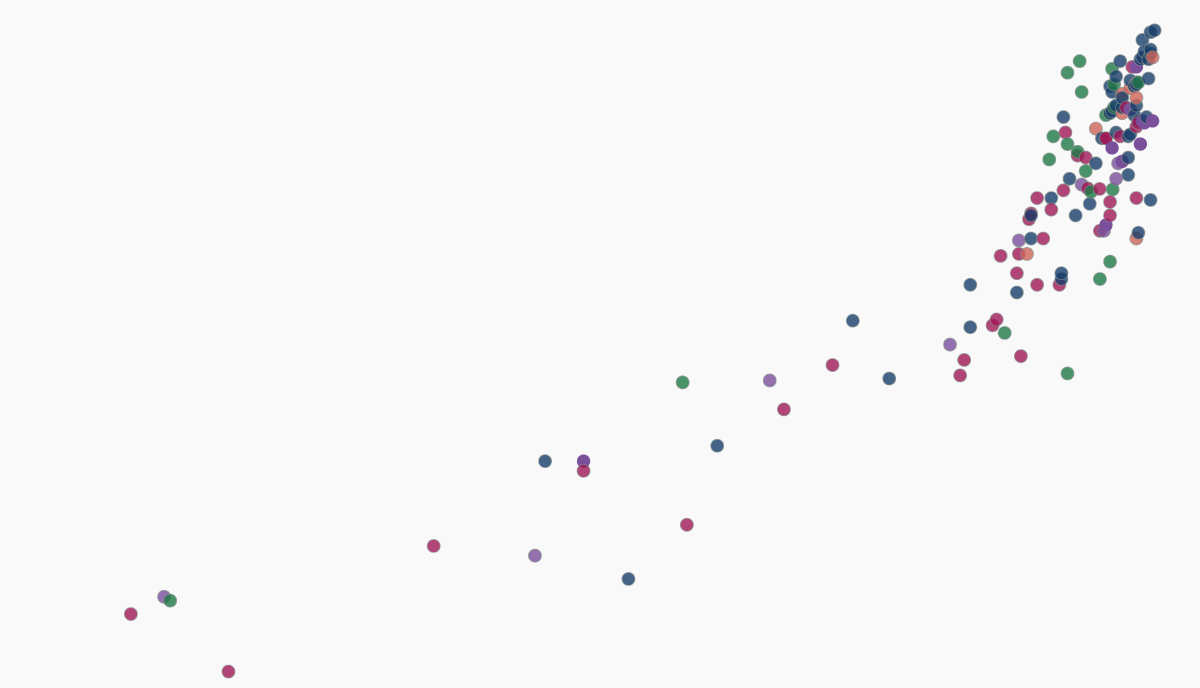
The recent evolution of AI, particularly large language models, is closely tied to the surge in computational power. Each dot on this chart represents a distinct language model. The horizontal axis shows the training computation used (on a logarithmic scale), measured in total floating point operations (“FLOP”). The vertical axis indicates the model's performance on the Massive Multitask Language Understanding (MMLU) benchmark, an extensive knowledge test composed of thousands of multiple-choice questions across 57 diverse subjects, from science to history.

As training computation has risen, so has performance on these knowledge tests.

OpenAI's GPT-4, released in 2023, achieved an 86% accuracy on the MMLU benchmark. This far exceeds the 34.5% accuracy achieved by non-expert humans, and comes close to the 89.8% accuracy estimated for hypothetical human experts1 who excel across all 57 subjects covered in the test.2

AI made profound advances with few resources – now investments have increased substantially

AI technology has become much more powerful over the past few decades. In recent years, it has found applications in many different domains.

A lot of this was achieved with only small investments. But this has increased dramatically in recent years. Investments in 2021 were about 30 times larger than a decade earlier.

Given how rapidly AI developed in the past – despite its limited resources – we might expect AI technology to become much more powerful in the coming decades, now that the resources dedicated to its development have increased so substantially.

AI hardware production, especially CPUs and GPUs, is concentrated in a few key countries

The machines that power AI systems rely heavily on specific hardware. These include central processing units (CPUs) and graphics processing units (GPUs), which allow them to analyze and process vast amounts of information.

More than 90% of these chips are designed and assembled in only a handful of countries: the United States, Taiwan, China, South Korea, and Japan.

While reporting on AI tends to focus on software and algorithmic improvements, a few countries could, therefore, dictate the direction and evolution of AI technologies through their influence on hardware.

Research & Writing

Interactive Charts on Artificial Intelligence

Endnotes

  1. We write “hypothetical” because no single person could perform this well across such varied tests. The authors based their analysis on expert performance on a subset of the tests for which there is human performance data – with “experts” considered to have the 95th percentile scores – and imagined a hypothetical person who would perform at this very high level across all tasks.

  2. Hendrycks, Dan, et al. "Measuring massive multitask language understanding." arXiv preprint arXiv:2009.03300 (2020). https://arxiv.org/abs/2009.03300

Cite this work

Our articles and data visualizations rely on work from many different people and organizations. When citing this topic page, please also cite the underlying data sources. This topic page can be cited as:

Charlie Giattino, Edouard Mathieu, Veronika Samborska and Max Roser (2023) - “Artificial Intelligence” Published online at OurWorldInData.org. Retrieved from: 'https://ourworldindata.org/artificial-intelligence' [Online Resource]

BibTeX citation

@article{owid-artificial-intelligence,
    author = {Charlie Giattino and Edouard Mathieu and Veronika Samborska and Max Roser},
    title = {Artificial Intelligence},
    journal = {Our World in Data},
    year = {2023},
    note = {https://ourworldindata.org/artificial-intelligence}
}
Our World in Data logo

Reuse this work freely

All visualizations, data, and code produced by Our World in Data are completely open access under the Creative Commons BY license. You have the permission to use, distribute, and reproduce these in any medium, provided the source and authors are credited.

The data produced by third parties and made available by Our World in Data is subject to the license terms from the original third-party authors. We will always indicate the original source of the data in our documentation, so you should always check the license of any such third-party data before use and redistribution.

All of our charts can be embedded in any site.