How much plastic waste ends up in the ocean?
Around 0.5% of plastic waste ends up in the ocean. Most of it stays close to the shoreline.
The world produces around 350 million tonnes of plastic waste each year.
What matters for environmental pollution is not necessarily how much waste we produce, but how it’s managed and where it ends up?
We’ve all seen stark images of plastic washed up on coastlines and in the middle of the oceans. How much of our waste ends up there?
Around 0.5% of the world’s plastic waste. Let’s see how we get to this number.
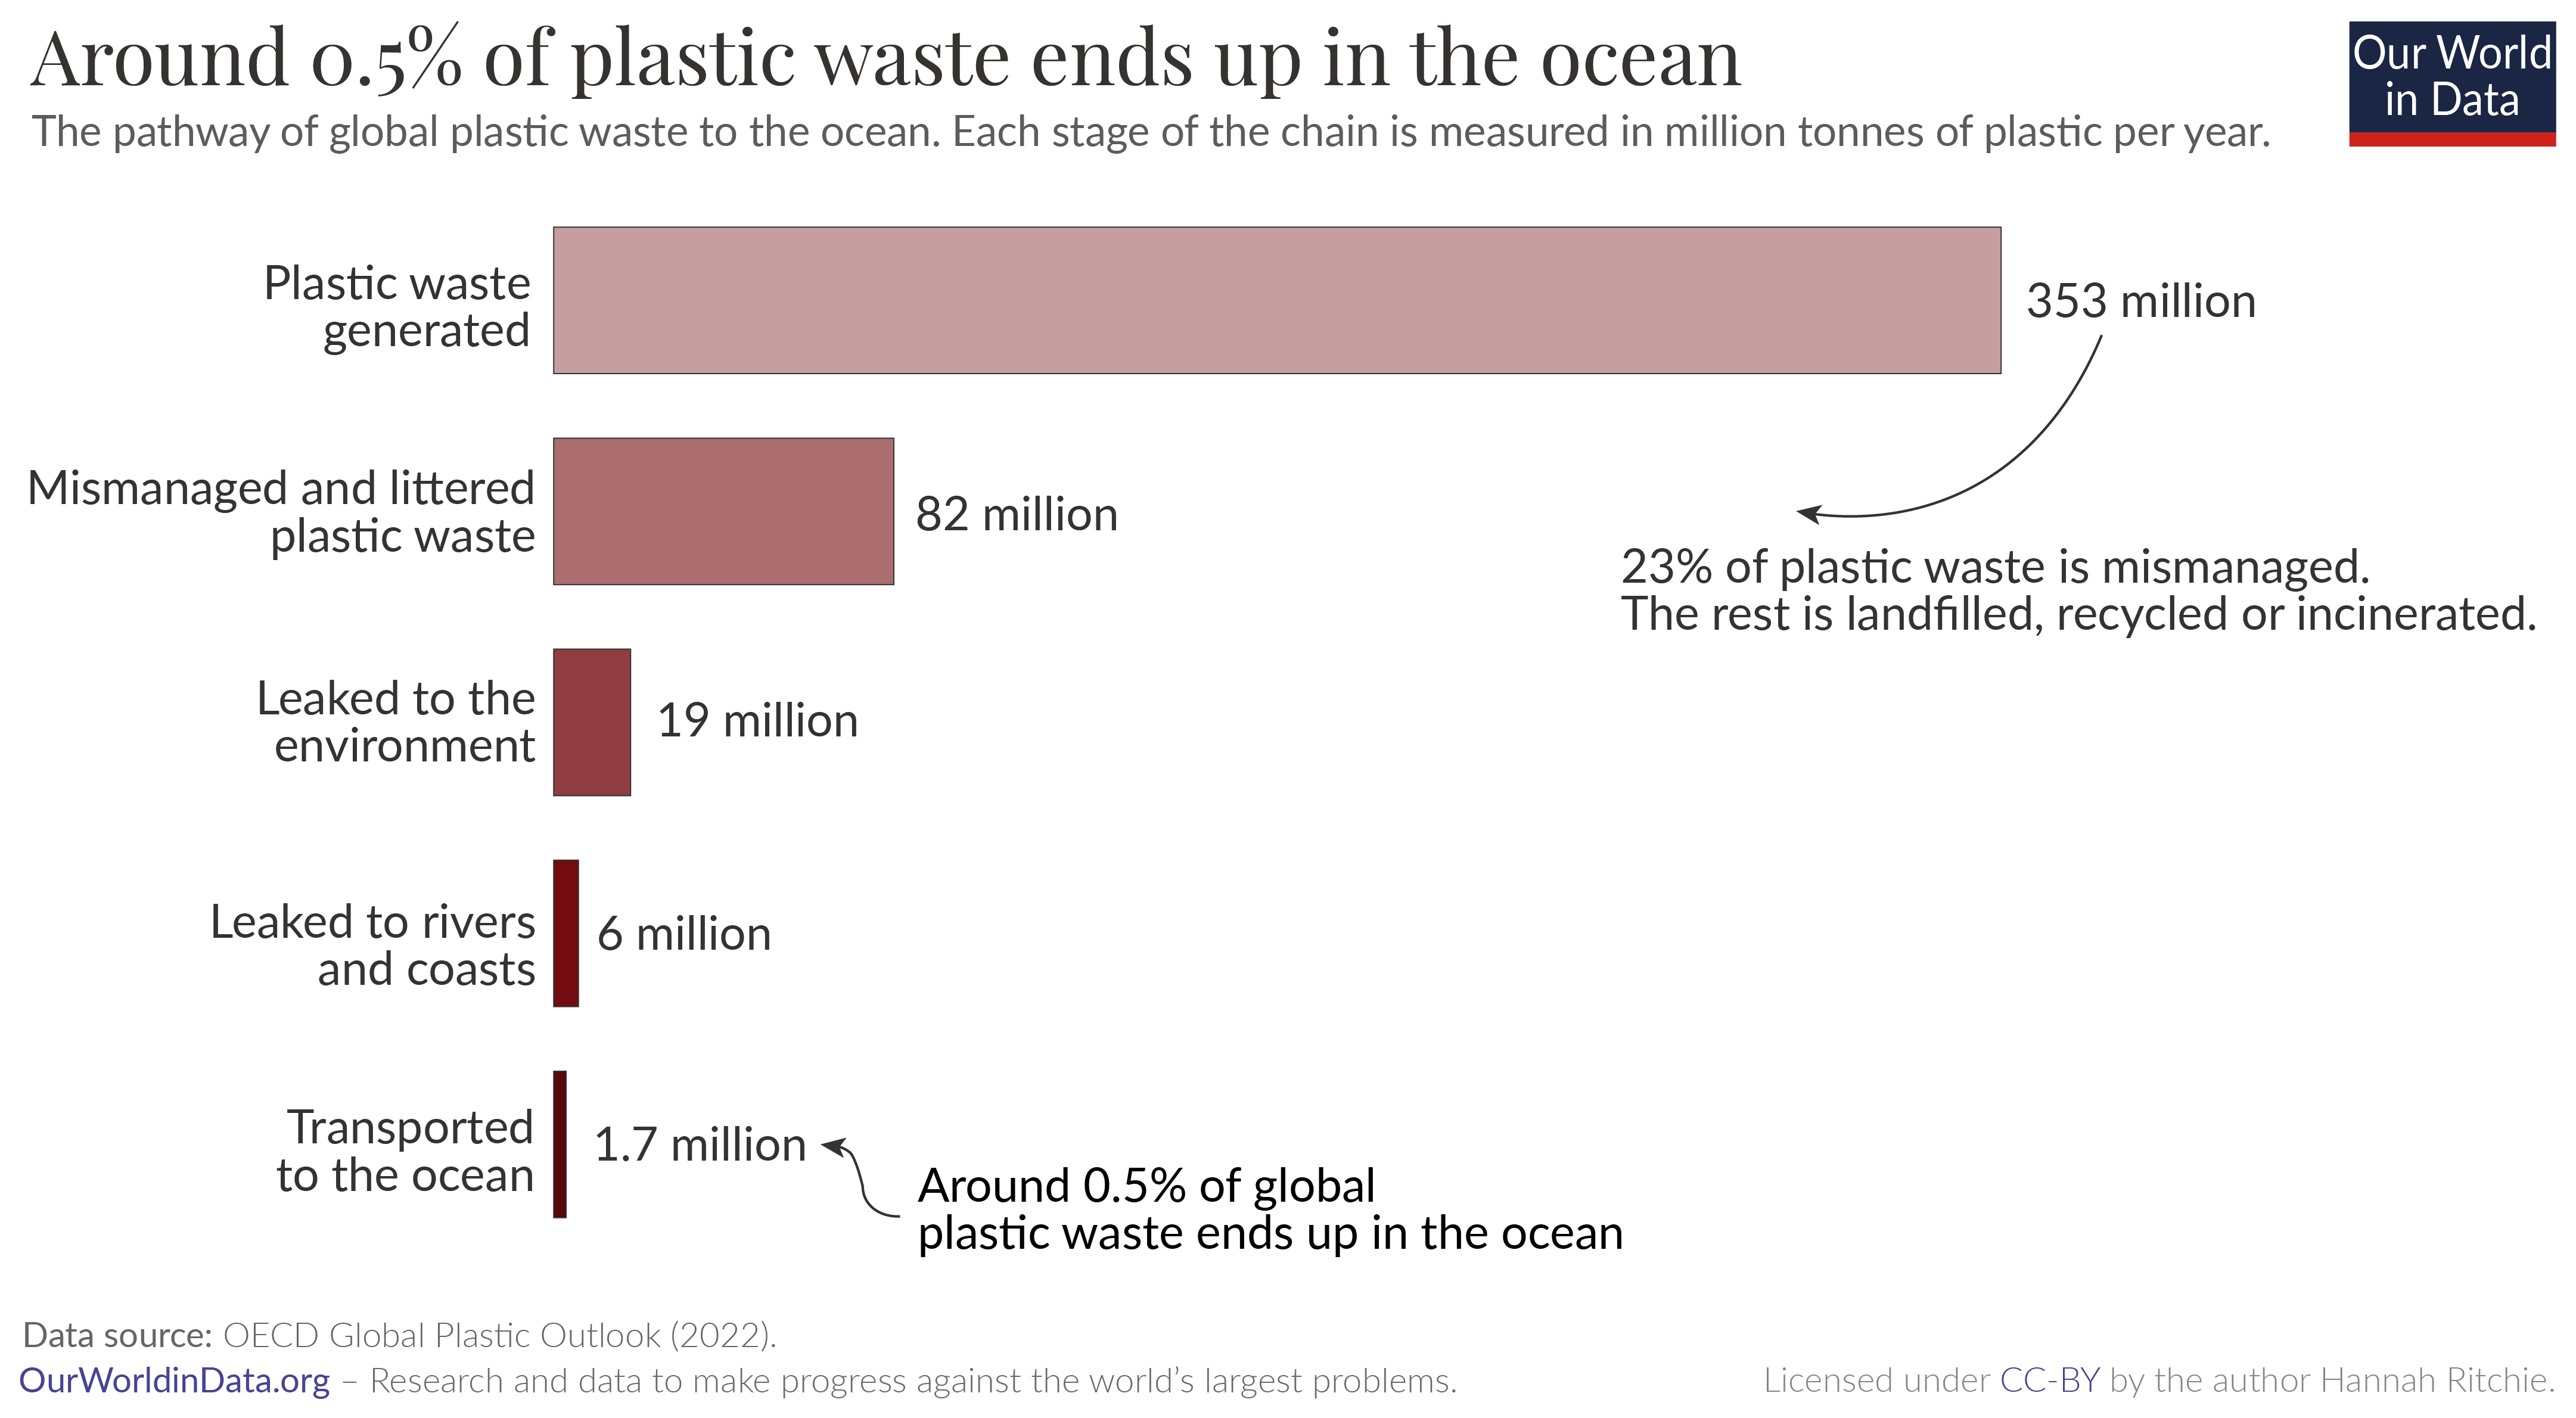
In the chart below you can see the path of plastic waste to the oceans. This comes from the OECD’s Global Plastic Outlook (2022).1
Nearly one-quarter of the world’s plastic waste is mismanaged or littered. Around 82 million tonnes. This means it’s not stored in secure landfills, recycled or incinerated.
One-quarter of that – 19 million tonnes – is leaked to the environment. 13 million tonnes to terrestrial environments, and 6 million tonnes to rivers or coastlines.
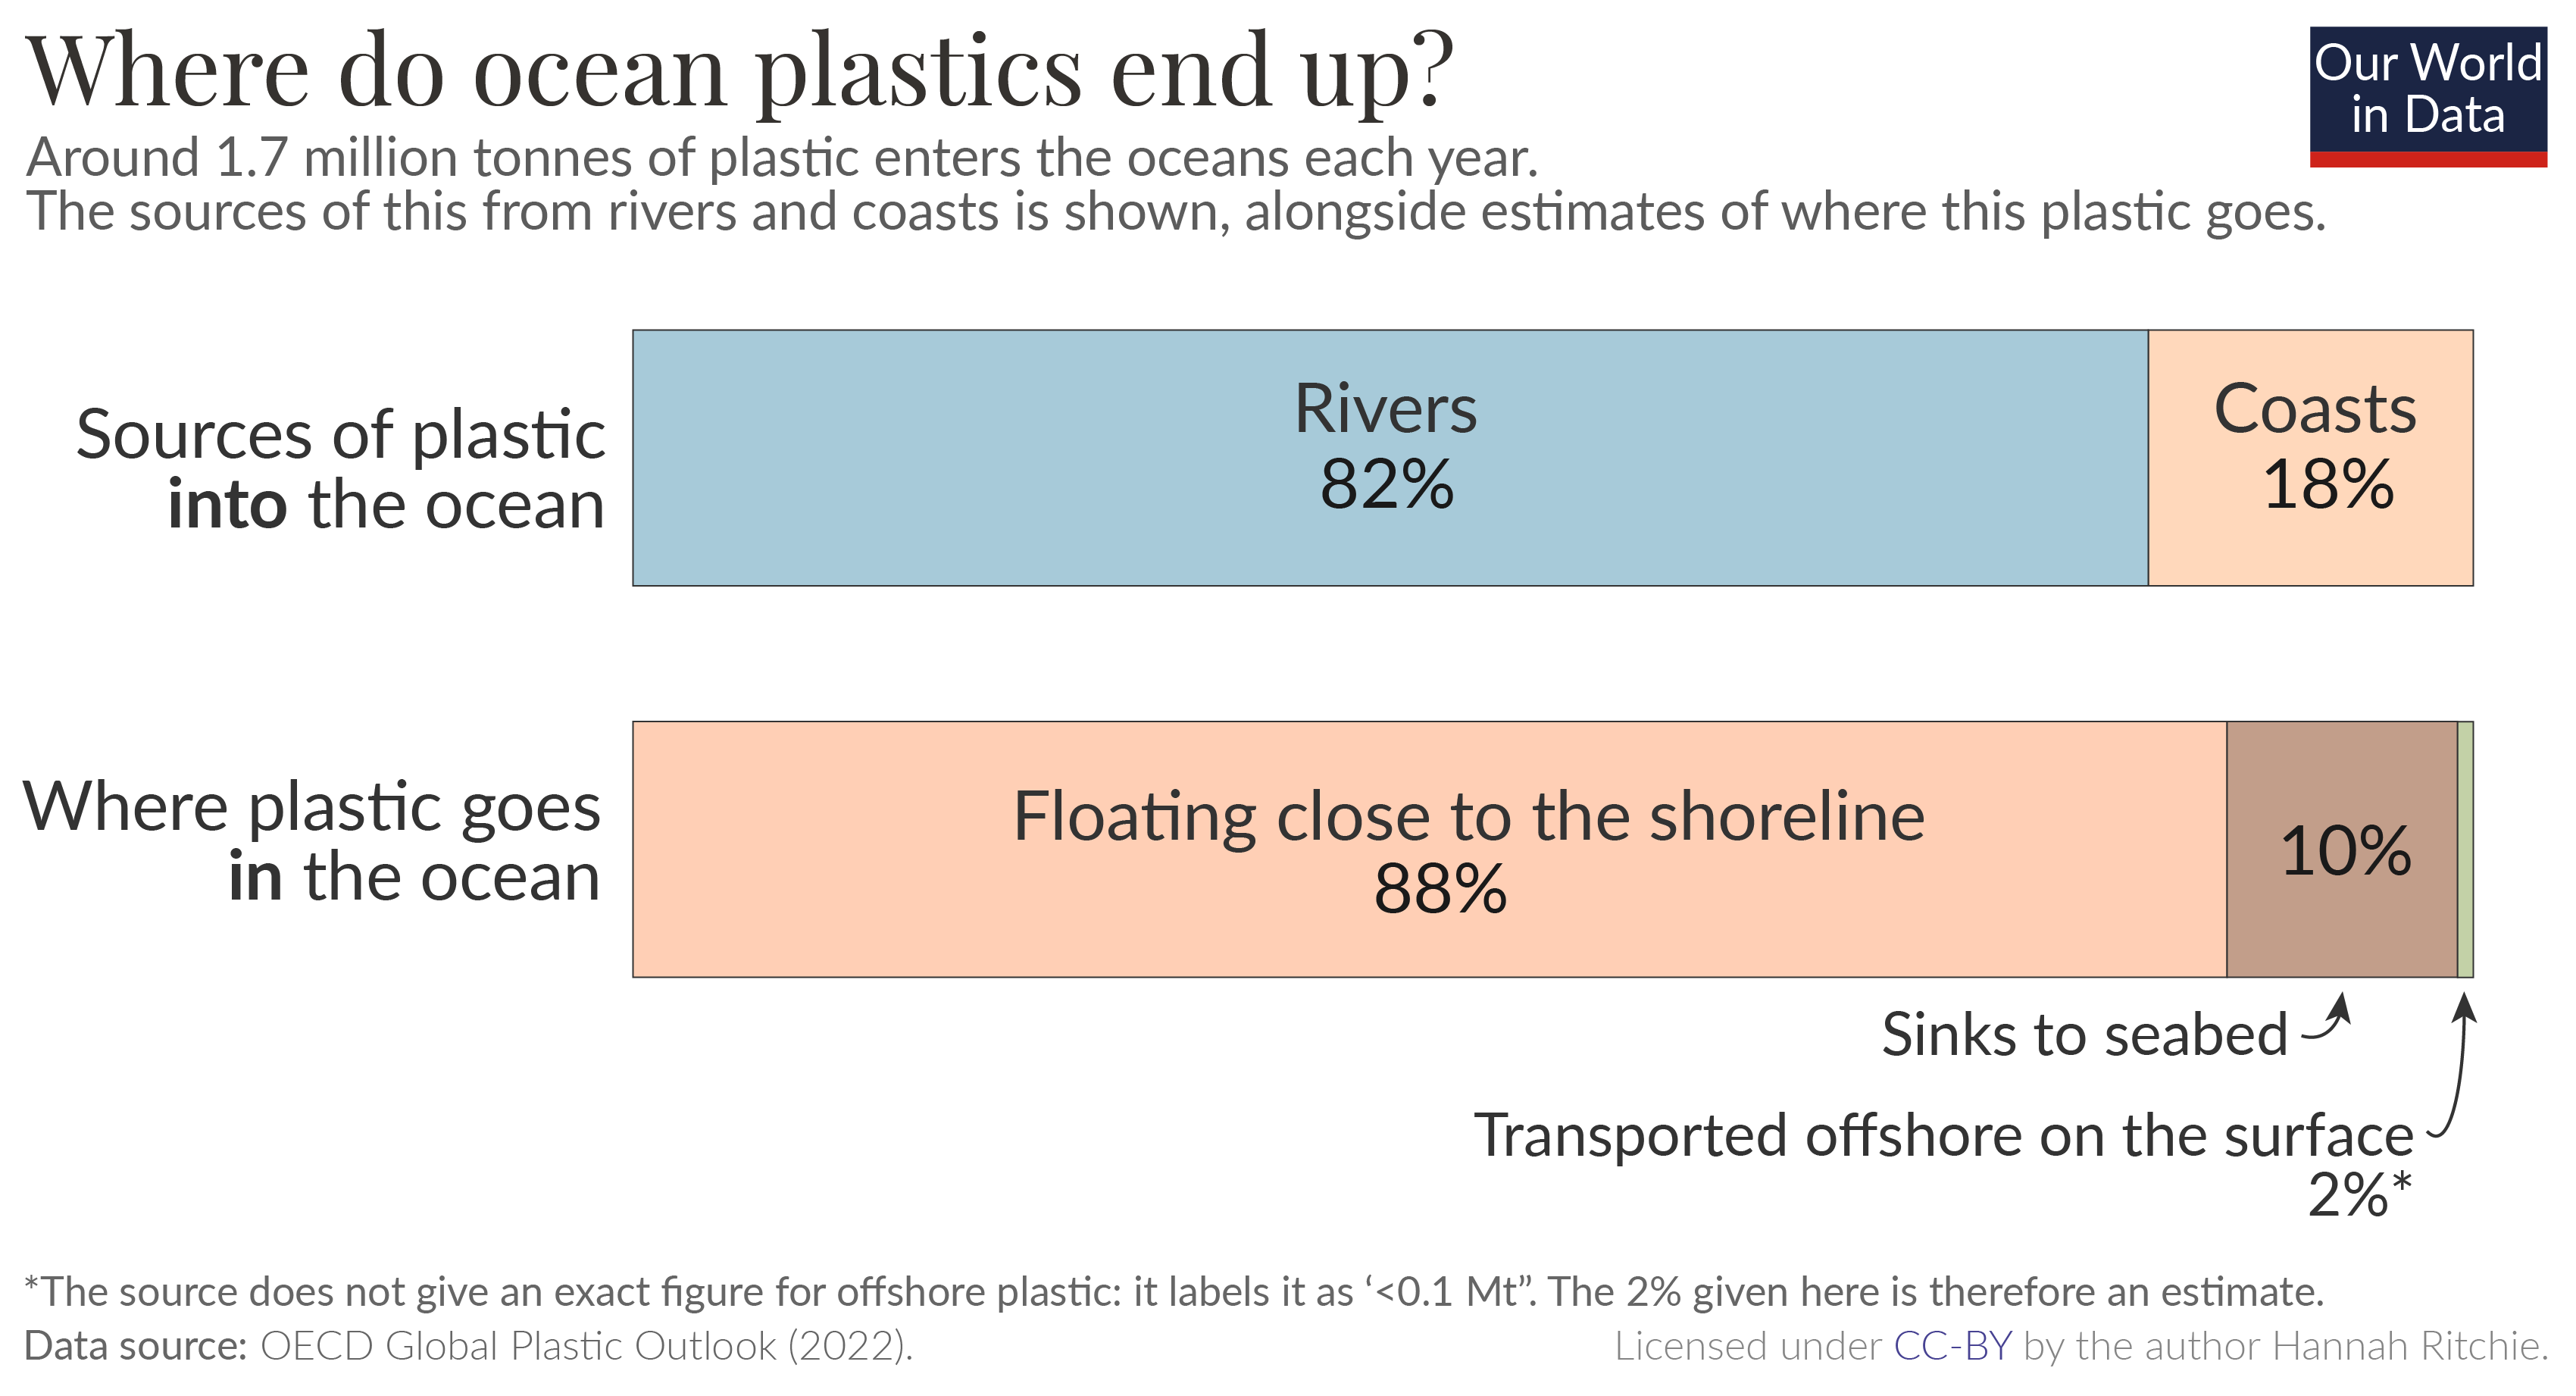
1.7 million tonnes of this is then transported to the ocean: 1.4 million tonnes from rivers, and 0.3 million tonnes from coastlines. The rest of the plastic waste that was leaked into aquatic environments accumulated in rivers and lakes.
That means that around 0.5% of world’s plastic waste ends up in the oceans.

Exactly how much plastic waste enters the oceans is still uncertain. Early studies produced larger figures, estimating that ocean plastics could be around 8 million tonnes per year.2
More recent research – with improved methods – estimates that this figure is somewhere between 1 million and 1.7 million tonnes.3
What happens to plastic once it enters the ocean?
The fate of plastics once they enter the ocean has been something of a puzzle for researchers. At least one million tonnes of plastic enters the ocean each year.
But the amount of plastic floating on the surface offshore is order of magnitudes less. Some estimates are in the range of tens to hundreds of thousands of tonnes.4 A large amount, but not close to the tens of millions of tonnes that have flowed into the oceans over many years.
This has been described as the ‘missing plastic problem’.5
There are various possible explanations: that our estimates are very inaccurate. While our estimates are uncertain, it’s unlikely that they would be out by orders of magnitude. Another is that ultraviolet light breaks plastics down very quickly. This could be partly true: we know that there are large amounts of microplastics – very small plastic particles – in deep-sea sediments.6
The third explanation is that one a fraction of ocean plastics are transported out to sea, and buoyant on the surface. Some sinks to the seabed. But most stays very close to the shoreline, where it gets trapped and resurfaced along the coast.
This is a conclusion we see from numbers from the OECD. It estimates that 1.5 million tonnes out of the 1.7 million that enters the oceans remains close to the shoreline. 0.2 million tonnes sinks to the seabed. And less than 0.1 million tonnes is transported offshore on the surface.
A study by Laurent Lebreton, Matthias Egger and Boyan Slat reached a similar conclusion.7 It found that most large plastics that enter the ocean are washed up, buried, and resurfaced along shorelines. While most were less than 5 years old, some were more than 15 – suggesting that these plastics can persist and accumulate over long periods of time.
While it’s often plastics floating in the open sea that capture our attention, this is probably only a fraction of the plastic that enters the ocean.

Endnotes
OECD (2022), Global Plastics Outlook: Economic Drivers, Environmental Impacts and Policy Options, OECD Publishing, Paris, https://doi.org/10.1787/de747aef-en.
Jambeck, J. R., Geyer, R., Wilcox, C., Siegler, T. R., Perryman, M., Andrady, A., ... & Law, K. L. (2015). Plastic waste inputs from land into the ocean. Science, 347(6223), 768-771.
The OECD Global Plastics Outlook estimates that 1.7 million tonnes ends up in the oceans.
A recent study by Meijier et al. (2021) estimates that this figure is around 1 million tonnes.
OECD (2022), Global Plastics Outlook: Economic Drivers, Environmental Impacts and Policy Options, OECD Publishing, Paris, https://doi.org/10.1787/de747aef-en.
Meijer, L. J., Van Emmerik, T., Van Der Ent, R., Schmidt, C., & Lebreton, L. (2021). More than 1000 rivers account for 80% of global riverine plastic emissions into the ocean. Science Advances, 7(18), eaaz5803.
Eriksen, M. et al. Plastic pollution in the world’s oceans: more than 5 trillion plastic pieces weighing over 250,000 tons afloat at sea. Plos One 9, e111913 (2014).
Lebreton, L., Slat, B., Ferrari, F., Sainte-Rose, B., Aitken, J., Marthouse, R., … & Noble, K. (2018). Evidence that the Great Pacific Garbage Patch is rapidly accumulating plastic. Scientific Reports, 8(1), 4666. Available at: https://www.nature.com/articles/s41598-018-22939-w.
Woodall, L. C., Sanchez-Vidal, A., Canals, M., Paterson, G. L., Coppock, R., Sleight, V., … & Thompson, R. C. (2014). The deep sea is a major sink for microplastic debris. Royal Society Open Science, 1(4), 140317.
Lebreton, L., Egger, M., & Slat, B. (2019). A global mass budget for positively buoyant macroplastic debris in the ocean. Scientific reports, 9(1), 1-10.
Cite this work
Our articles and data visualizations rely on work from many different people and organizations. When citing this article, please also cite the underlying data sources. This article can be cited as:
Hannah Ritchie (2023) - “How much plastic waste ends up in the ocean?” Published online at OurWorldInData.org. Retrieved from: 'https://ourworldindata.org/how-much-plastic-waste-ends-up-in-the-ocean' [Online Resource]BibTeX citation
@article{owid-how-much-plastic-waste-ends-up-in-the-ocean,
    author = {Hannah Ritchie},
    title = {How much plastic waste ends up in the ocean?},
    journal = {Our World in Data},
    year = {2023},
    note = {https://ourworldindata.org/how-much-plastic-waste-ends-up-in-the-ocean}
}
Reuse this work freely
All visualizations, data, and code produced by Our World in Data are completely open access under the Creative Commons BY license. You have the permission to use, distribute, and reproduce these in any medium, provided the source and authors are credited.
The data produced by third parties and made available by Our World in Data is subject to the license terms from the original third-party authors. We will always indicate the original source of the data in our documentation, so you should always check the license of any such third-party data before use and redistribution.
All of our charts can be embedded in any site.

