Population momentum: If the number of children per woman is falling, why is the population still increasing?
50 years ago the average woman in world had five children. This figure has more than halved. Yet the global population is still rising – why?
Note: This article was published in 2019, and has not been updated with the latest demographic data. While the numbers might now be slightly different, the principles and concepts remain true.
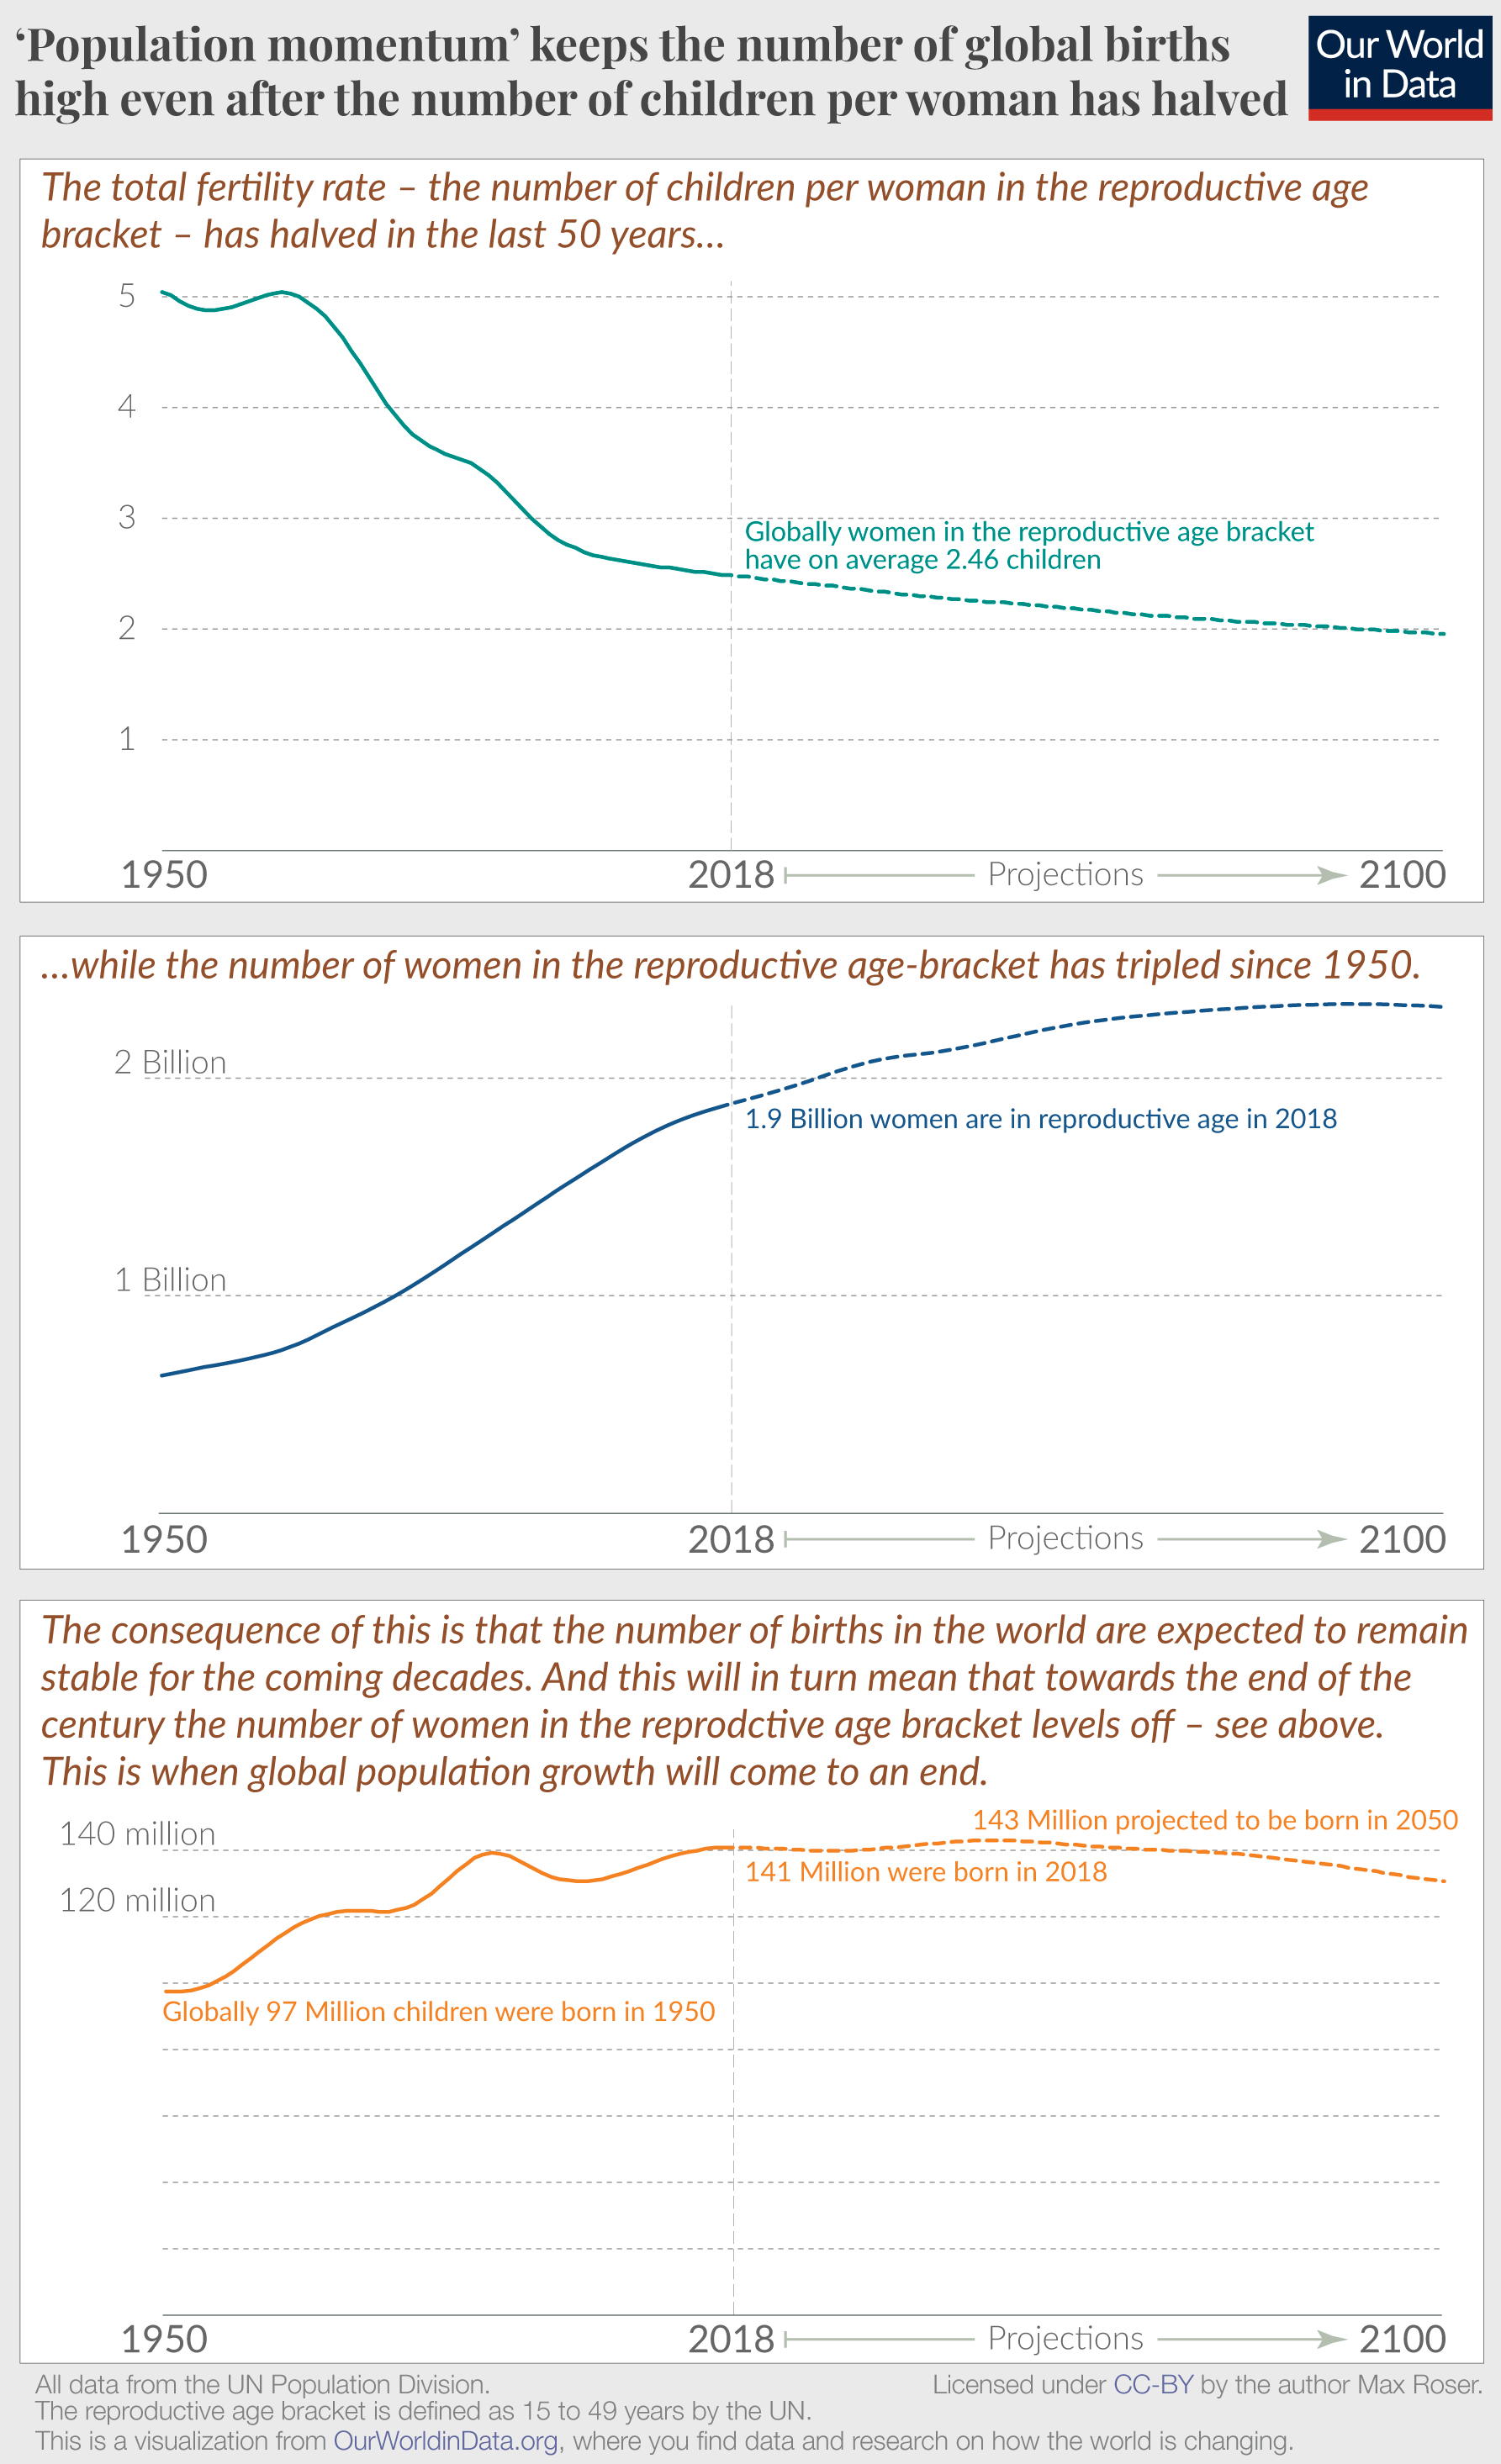
In 1965 the average woman on the planet had 5 children. 50 years later this statistic – called the total fertility rate – has fallen to below 2.5. The global fertility rate has halved. The first panel in the chart shows this fundamental change.
The total fertility rate at which a population replaces itself from one generation to the next is called the replacement fertility rate. If no children died before they grew up to have children themselves the replacement fertility rate would be 2. Because some children die, the global replacement fertility rate is currently higher than 2, only slightly lower than the actual global fertility rate. Why then is global population growth not coming to an end yet?
The number of births per woman in the reproductive age bracket is only one of two variables that matter here. The second one is the number of women in the reproductive age bracket.
If there were few women in the reproductive age bracket, the number of births would be low even when the fertility rate is high. At times when an increasing share of women enter the reproductive age bracket however, the population can keep growing even if the fertility rate is falling. This is what demographers refer to as ‘population momentum’ and it explains why the number of children in the world will not decline as rapidly as the fertility rate. Hans Rosling explained it better than anyone, with the help of toilet rolls.
The second chart in this panel shows that the population growth over the last decades resulted in increasingly larger cohorts of women in the reproductive age bracket.
As a result, the number of births will stay high even as the number of births per woman is falling. This is what the bottom panel in the chart shows. According to the UN projections, the two drivers will cancel each other out so that the number of births will stay close to the current level for many decades to come.
This means that the coming decades will be very different from the last when the annual number of births increased rapidly as the visualization shows.
Population momentum is one important driver for high population growth. But it of course also matters that we today live much longer than our ancestors just a few generations ago. Life expectancy is now twice as long in all world regions.
In all of this it is also important to keep in mind that these are projections and how the future will actually play out will depend on what we are doing today.
Population momentum is driven by the increasingly large cohorts of women in the reproductive age bracket. It’s only when both the fertility rate and the number of women level off that population momentum stops. And this is when global population growth will come to an end.

Cite this work
Our articles and data visualizations rely on work from many different people and organizations. When citing this article, please also cite the underlying data sources. This article can be cited as:
Max Roser (2023) - “Population momentum: If the number of children per woman is falling, why is the population still increasing?” Published online at OurWorldInData.org. Retrieved from: 'https://ourworldindata.org/population-momentum' [Online Resource]BibTeX citation
@article{owid-population-momentum,
    author = {Max Roser},
    title = {Population momentum: If the number of children per woman is falling, why is the population still increasing?},
    journal = {Our World in Data},
    year = {2023},
    note = {https://ourworldindata.org/population-momentum}
}
Reuse this work freely
All visualizations, data, and code produced by Our World in Data are completely open access under the Creative Commons BY license. You have the permission to use, distribute, and reproduce these in any medium, provided the source and authors are credited.
The data produced by third parties and made available by Our World in Data is subject to the license terms from the original third-party authors. We will always indicate the original source of the data in our documentation, so you should always check the license of any such third-party data before use and redistribution.
All of our charts can be embedded in any site.

